August 2012 -
Baseball
We provide agents with powerful statistical analysis and research for arbitration, baseball free agency and long-term deal negotiations. Call Steve Fall at
512-852-8193 for more information.
Building Value with Team Achievements
Telling a free agent’s story requires more than analyzing their individual statistics.
While a player’s analytics comprise the majority of our free agency packages, we also
address key factors that relate to their specific circumstances, such as the strength
of their division or league. Highlighting pertinent team level achievements is another
great way to demonstrate player value.
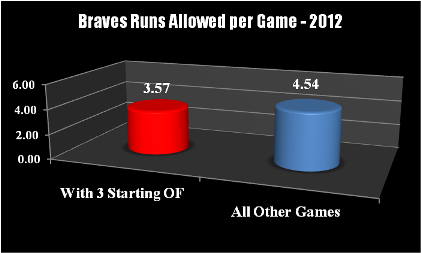
The Braves’ outfield defense makes a great example. Their starting
group – which includes two arbitration eligibles in Jason Heyward and
Martin Prado and potential free agent Michael Bourn – has shined this year.
The Atlanta outfield dominates team defensive statistics, especially advanced
metrics like Ultimate Zone Rating and Defensive Runs Saved.
The Braves had allowed the fewest triples (13) and second-fewest doubles (183)
in the NL (through August 16), which shows their outfielders’ range and skill.
When all three starters play, they have a huge impact on opponent scoring (see chart).
Contact us at steve.fall@sportsresource.net
or 512-852-8193 to
hear what our high-performance
analytics can do for your free agents and arbitration-eligible players.
Free Agency Challenges and Solutions
In recent years, analytics have helped change things for the better. In free agency and even the
arbitration process – where core numbers have considerable impact – pitchers can now land great
contracts without high win totals.
Starters with both a low win total and high ERA face a greater challenge. Potential free agent
Francisco Liriano, for example, had a 5.22 ERA through August 16. But all that matters to clubs
is what Liriano will achieve going forward. Some key 2012 trends provide insight into his future.
1) Tough Competition. Liriano had faced elite opponents far more often than the average pitcher
this season: 82.1 of his 120.2 innings pitched had come against teams with winning records. He
owned an excellent 3.76 ERA against clubs under .500.
2) Hitter’s Parks. An incredible 84 percent of Liriano’s innings pitched had come in
ballparks that increase run production. He had thrown 101.1 innings in hitter’s parks vs. just 19.1 in parks
that decrease run scoring.
3) Likely to Bounce Back. Liriano had an impressive 4.02 FIP (Fielding Independent Pitching)
figure. Developed by Fangraphs.com, FIP measures what a pitcher’s ERA should be assuming league
average performance on balls put in play. Pitchers with a high ERA and much lower FIP will usually
see their ERA improve significantly. Brandon Morrow’s 2011 and 2012 seasons make a great example.
Although Liriano struggled with his control this season, he had struck out an outstanding 9.85
batters per nine innings. How have pitchers with similar statistics performed in subsequent seasons?
To find out, we identified all pitchers age 26-to-30 in the past 25 seasons with 20+ starts, 4.5+
unintentional walks and 8.5+ strikeouts per nine innings. Then we combined stats in their
“comp” season and each of the next three years.
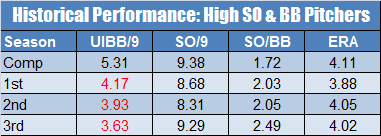
The pitchers dramatically improved their control in the next season, and continued this trend while pitching better overall.
The Sports Resource
Blog, Twitter and Facebook
The
Sports Resource Blog features posts of interest to sports agents.
"Like"
The Sports Resource Facebook page to receive insightful statistical
information. You can also follow Steve Fall on Twitter at
http://www.twitter.com/StatsMan.

Note:
All players used in this newsletter and our sample charts are selected at
random. None of the information comes from actual projects for agents. All projects and conversations
are confidential.
|