December 2012 -
Baseball
We provide agents with powerful statistical analysis and research for arbitration, baseball free agency and long-term deal negotiations. Call Steve Fall at
512-852-8193 for more information.
Creative Solutions for Setup Men
Both saves and holds focus exclusively on preserving leads. However, games tied in the late innings are much higher leverage
situations
than three-run eighth or ninth inning leads. Pitching a late-game shutout inning increases win probability by up to 14 percent.
Unfortunately, there's no core statistic for keeping a tie game deadlocked. That's bad news for a setup man like Darren O'Day. He had 15
holds in 2012, but pitched better overall than comparable arbitration eligible setup men in his service class with higher
totals.
O'Day, who ranked among the 2012 MLB relief leaders in win probability added, was lights out in tie games. He entered 16 tie games and
left each one with the score still knotted. He posted a 0.48 ERA, allowed just five hits in 18.2 innings, and stranded all eight
inherited runners. His only run allowed came from a two-out walk that the following reliever let score.
O'Day led all Major League setup men in "tie holds", a stat we created for games in which a reliever preserves a tie
and records at
least one out.
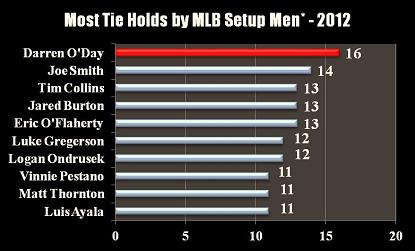
O'Day joined other arbitration-eligible setup men like Eric O'Flaherty, Luke Gregerson, Logan Ondrusek, and Joe Smith on this list. O'Day stood out
in another way: The Orioles won 15 of the 16 games in
which he preserved ties. Only teammate Luis Ayala (10) joined him in double figures among MLB setup men.
What Wins in October? And What it Means for Arbitration
Contributing to a championship team pays off in arbitration. Imagine if your player also excels in categories that have the greatest
correlation with postseason success. For this reason, we completed a thorough study of the past ten MLB postseasons. Most studies like
this examine how successful teams reach the playoffs. We focused on what wins once teams get there and need to face other
elite clubs.
One statistic differentiated World Series Champions from postseason non-winners more than any other: The rate of home runs
allowed.
World Series winners allowed 2.30 home runs per 100 batters faced. All other playoff clubs surrendered 2.98. That's nearly a 30 percent
difference!
Then we can take this down to the player level to identify pitchers who kept the ball in the park with the pressure on. This data covers
the past five postseasons (minimum: 20 postseason innings).
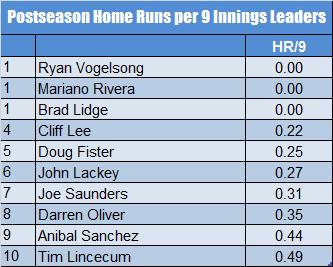
Neither Ryan Vogelsong nor Tim Lincecum allowed a single home run in the 2012 postseason. Doug Fister, who is arbitration eligible, also shined
in this category. Although his Tigers had a strong postseason, they fell short of winning it all. Nonetheless, Fister and teammate Anibal Sanchez excelled
at avoiding the long ball.
Contact us at 512-852-8193 or steve.fall@sportsresource.net to
hear what our high-performance analytics can do for your arbitration-eligible players and free agents.
Building Value for Arbitration
The Sports Resource Blog recently featured a post on Four Ways to
Build Value for Arbitration.
Check back later this offseason for more insightful articles.
The Sports Resource
Blog, Twitter and Facebook
The
Sports Resource Blog features posts of interest to sports agents.
"Like"
The Sports Resource Facebook page to receive insightful statistical
information. You can also follow Steve Fall on Twitter at
http://www.twitter.com/StatsMan.

Note:
All players used in this newsletter and our sample charts are selected at
random. None of the information comes from actual projects for agents. All projects and conversations
are confidential.
|