July 2014 -
Baseball
We provide agents with powerful statistical analysis and research for arbitration, baseball free agency and long-term deal negotiations. Call Steve Fall at
404-447-1861 for more information.
Park Effects, Arbitration, and Free Agency
Park effects have a major impact on statistics, which can influence how teams value their players.
Should a current trend continue, agents for Phillies and Orioles hitters will want to make ballpark adjustments in their arbitration
briefs and free agency packages. Both Citizens Bank Park and Camden Yards had decreased run production tremendously this season
(through July 8).
Camden Yards - which historically increases offense - had decreased run scoring more than any MLB park. Citizens Bank Park, another
good park for offense in the past, ranked just 29th in 2014.
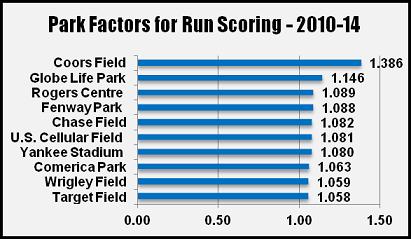
Park factors are valuable for deciding the best home ballparks for your free agents. We recommend using multi-year
park factors for this purpose. The chart shows the best hitter's parks for the past five seasons.
Please note that since Target Field opened in 2012, its data includes three seasons. A park factor of 1 is neutral with no impact on scoring.
As part of our free consultation, The Sports Resource will explain how park factors impact
your clients in both free agency and arbitration.
Adjusting for the Drop in Run Scoring
Offense is down in Major League Baseball this season. So the timing couldn't be worse for agents with arbitration-eligible and
free agent hitters this offseason.
Clubs will likely use comparable players from recent seasons with a
higher run context, which presents a challenge for agents. Fortunately, there is a solution. Agents can adjust for this change
like an economist adjusts for inflation. Some advanced metrics already include such adjustments, and The Sports Resource developed
proprietary methods for these situations.
Why is this vital? It creates opportunities to use comparables with better stats. For example, a second-time
arbitration eligible
this offseason could use Garrett Jones 2012 season as a comparable, even if his core numbers don't quite match up.
Jones had 27 home runs, 86 RBI, and an .832 OPS in 2012, but NL teams scored 4.22 runs per game that year compared to 3.97 in 2014.
In this season's run context, a second-time eligible with 24 homers, 81 RBI and a .811 OPS matches up with Jones, if all other stats
are comparable.
Taking Control of Your Web Presence
When fans attend a baseball game, the stadium employees don't say "Thanks for coming, but you can watch the game much better at
home on television." That's basically what happens when agent and player websites post links to content on ESPN, MLB.com and other
popular websites.
This approach not only directs visitors off your website, but you cede control of messaging and branding to outsiders. While
occasionally sharing links is okay, some agents rely on this approach for nearly all digital content - on both websites and social
media accounts.
The best approach is to create compelling original web content. This not only gives agents control over messaging,
but enhances search engine ranking. We detailed the benefits of this approach in a
recent Sports Resource Blog post.
Our data-driven digital solutions combine the power of sports analytics with web development and content creation. This strategy
helps players land endorsements and monetize their digital presence. Contact Steve Fall at 404-447-1861 or
steve.fall@sportsresource.net
for a free consultation.
The Sports Resource
Blog, Twitter and Facebook
The
Sports Resource Blog features posts of interest to sports agents.
"Like"
The Sports Resource Facebook page to receive insightful statistical
information. You can also follow Steve Fall on Twitter at
https://www.twitter.com/StatsMan.

Note:
All players used in this newsletter and our sample charts are selected at
random. None of the information comes from actual projects for agents. All projects and conversations
are confidential.
|